|
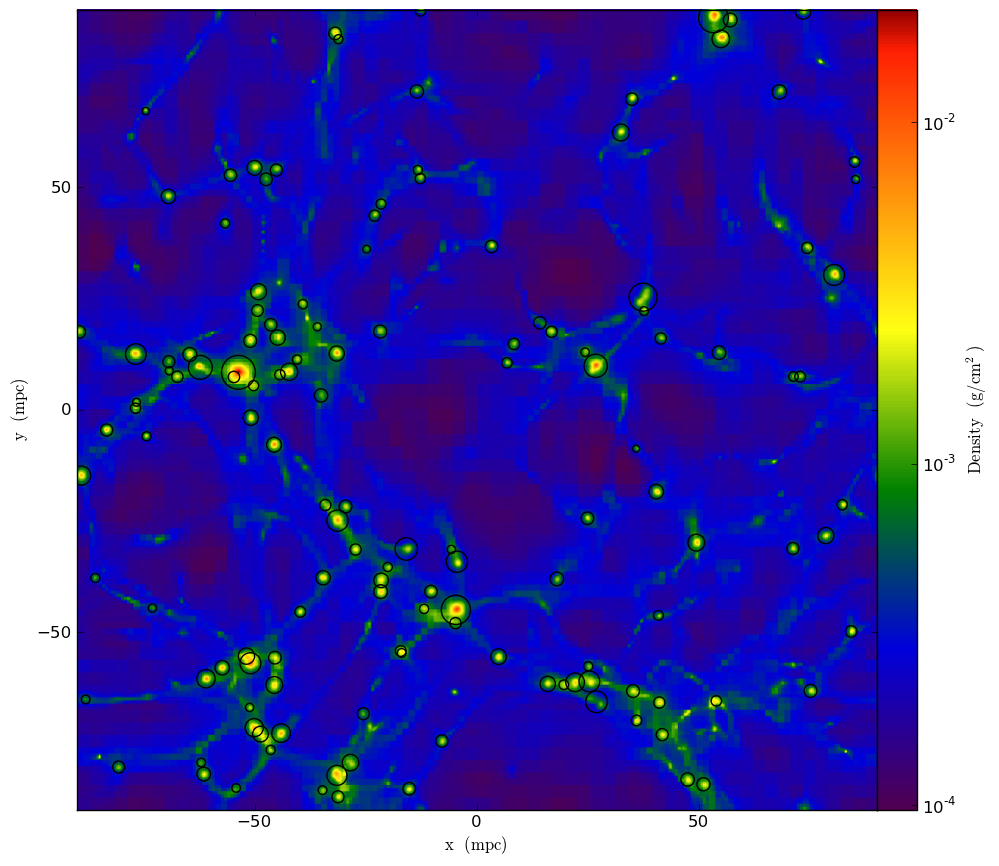
ytyt is a Python-based astrophysics analysis tool that utilizes NumPy, Matplotlib, and MPI for Python (only for parallel computations). The following document is a directed mining of the comprehensive info contained at the yt project's documentation page. From that site: "yt was designed to be a completely Free ... user-extensible framework for analyzing and visualizing astrophysical data, currently working with several different codes, including the "flagship" codes Enzo, Orion, Nyx and FLASH. It relies on no proprietary software although it can be and has been extended to interface with proprietary software and libraries and has been designed from the ground up to enable users to be as immersed in the data as they desire." Using ytyt separates analysis from visualization, and considers the former to be likely comprised of a series of creating new, accessible fields (from the possibly limited simulation output). Consider VisIt's or ParaView's typical execution pattern: a series of operations manipulate data for the purpose of creating a specific plot. The plot is further emphasized in that an analysis starts only after a plot is added and culminates when the plot is drawn. From yt's documentation: "While the heart of yt is the large set of basic code, physical, reduced, and plot objects already developed, in a metaphorical sense, its soul' is the fact that any of the objects can be used as starting points for creating fields and quantities of your own devices." Example 1: Finding and Plotting HalosThe following is a simple script that opens a dataset, performs the halo finding operation on the data, creates a plot of the data, and finally annotates the plot where halos were found (with black circles):
The result: a 2D projection plot that is saved to disk. In this image, areas corresponding to the location of found halos should be circled. Example 2: Parallel Computation with yt
A good deal of yt's functionality is designed to work in parallel (see yt's documentation page for a complete list). Furthermore, yt abstracts parallelism in that a user need only pass the
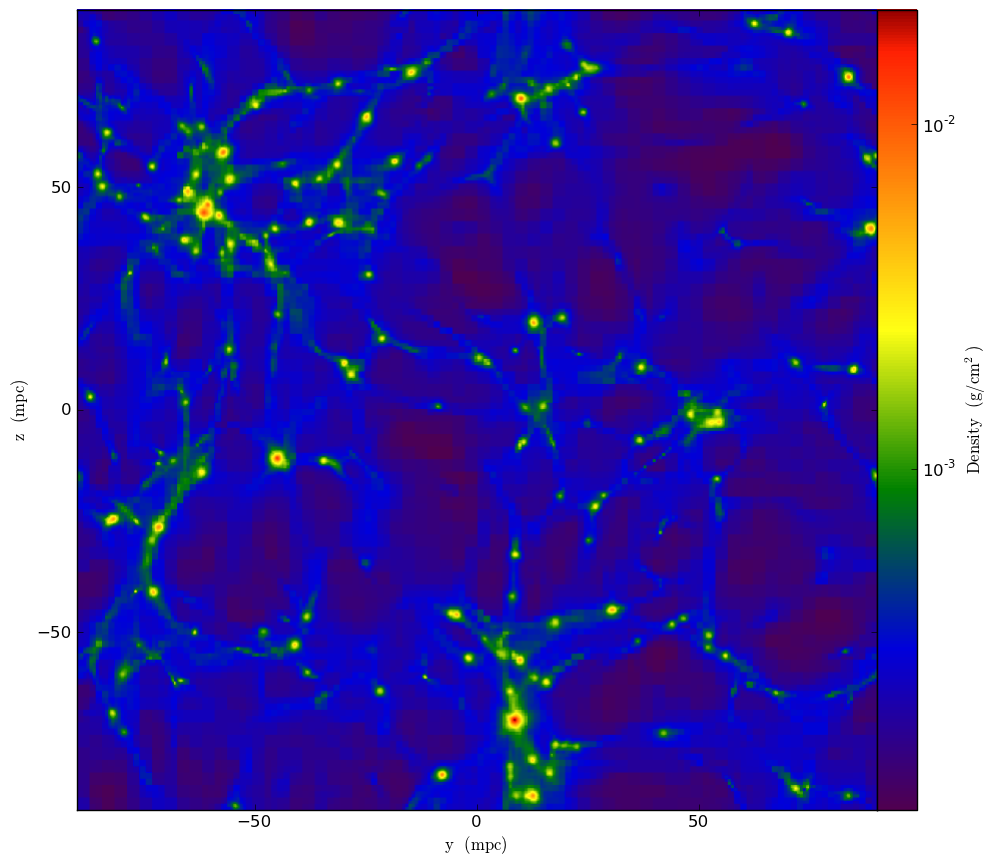
Here is a batch script that may be used to run the above script. During execution a each processor will print a hello world style message, and a resulting plot will be saved to disk, this time along the x-axis so the results of both example scripts won't clobber each other. Additional Information / References | |||||||||||||||||||||||||||||||
Skip to Content


Blue Waters User Portal
Sign In

Blue Waters is supported by the National Science Foundation (awards OCI-0725070 and ACI-1238993) the State of Illinois, and the National Geospatial-Intelligence Agency.
Contact Blue Waters Team with questions regarding this page.
Copyright 2024 Board of Trustees of the University of Illinois. All rights reserved. Web privacy notice.