Forge (formerly known as DDT: Distributed Debugging ToolDescriptionForge from ARM (formerly Allinea Software) is a parallel debugger that can be used for scalar, multi-threaded and large-scale parallel applications. The Allinea DDT web page and users guide is a good resource for learning more about some of the advanced DDT features. Helpful videos and blogs are available from the Allinea website. How to use Forge/DDTPrerequisitesSince Forge/DDT is GUI-based and does not provide command line interface X11 forwarding must be enabled for your login session. This can be done by passing -Y flag to ssh: > ssh -Y bw-duo.ncsa.illinois.edu NOTE: for memory debugging load the memory debugging module for Forge/DDT BEFORE linking > module load forge # no memory debugging or > module load ddt-memdebug # with memory debugging CompilationAdd -g flag to enable the generation of debugging information used by DDT, then (re)compile your program: Fortran example > ftn -g test.f90 -o test C example: > cc -g test.c -o test
Starting a debug session with DDT
The first three ways begin by loading the ddt module and starting DDT: > module unload altd ; module unload xalt > module load ddt-memdebug # (note the use of the ddt-memdebug module from above) > export DDT_NODE_SCAN_TIMEOUT=90 > export DDT_NO_TIMEOUT=1 > export DDT_PROCESS_TIMEOUT=0 > forge
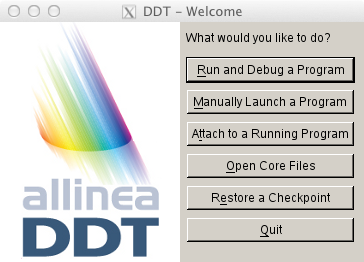
Submit a job through Forge/DDTSubmits a job, waits until the job is scheduled, and starts a debug session. Click on Run and Debug a Program . A new window with expandable tabs will appear, click on Details... to expand a tab.
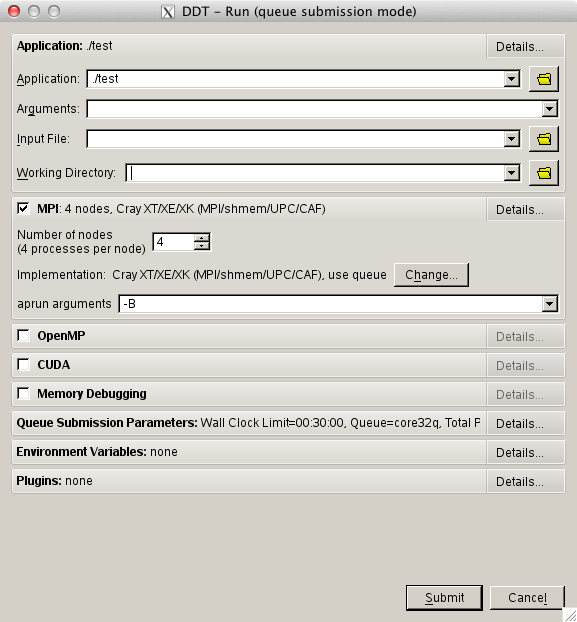
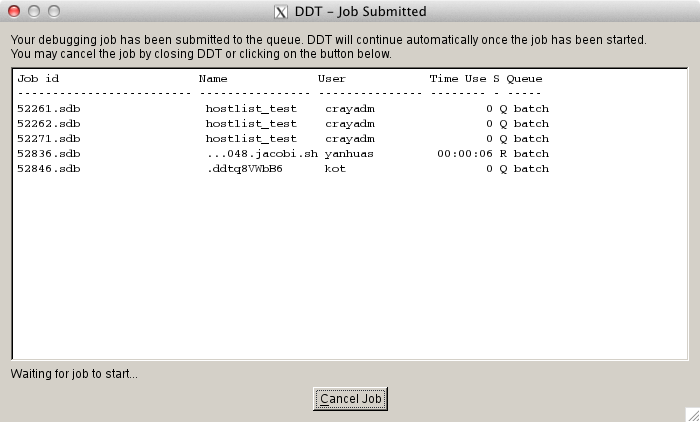
Application tab is used to select a program binary, working directory, arguments and input file. MPI, OpenMP, CUDA and Memory Debugging tabs are used to allow respective features and set parameters (e.g., number of nodes and processes per node for an MPI program). Queue Submission Parameters tab is used to change job parameters such as wall clock time, target queue, etc. Clicking on Submit button will submit a job to the scheduler, DDT will wait for the job to start.
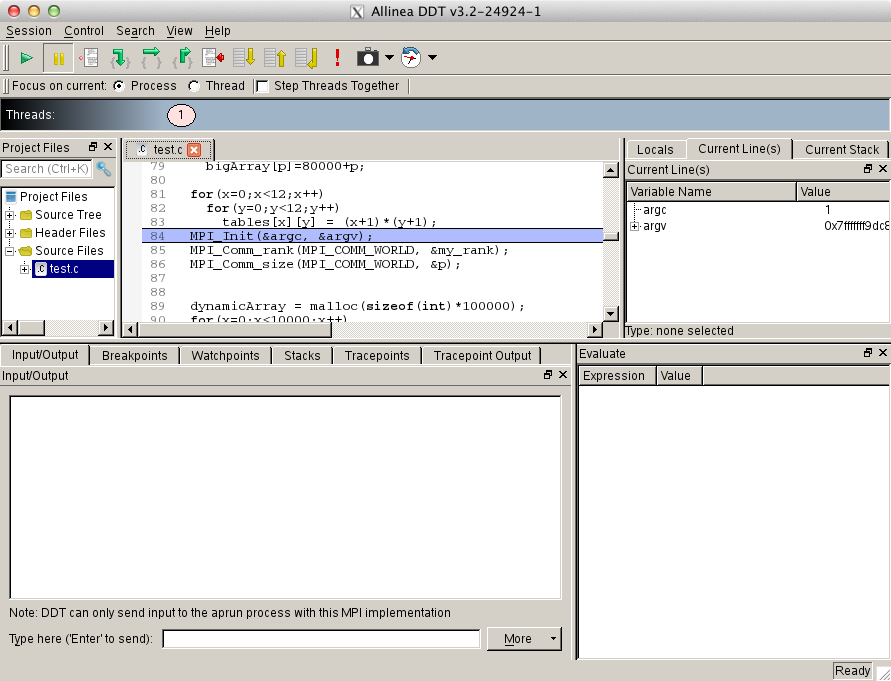
DDT will start a debug session automatically as soon as the job starts.
Manually launch a programManual launch allows debugging multi-process and multi-executable programs. To launch a program manually click on Manually Launch a Program button.
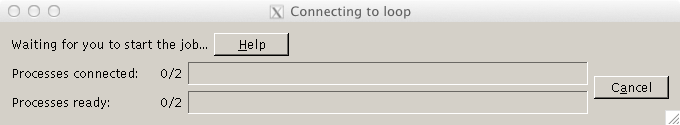
Select how many processes you want to debug and click on Listen . At this point start a program or programs using the following command: > forge-client <path-to-program-binary> Note, ddt-client command must be issues for each process selected at the previous window. The above command can also be used in a job submission script.
Forge/DDT will automatically start debugging session once all requested programs have been launched manually.
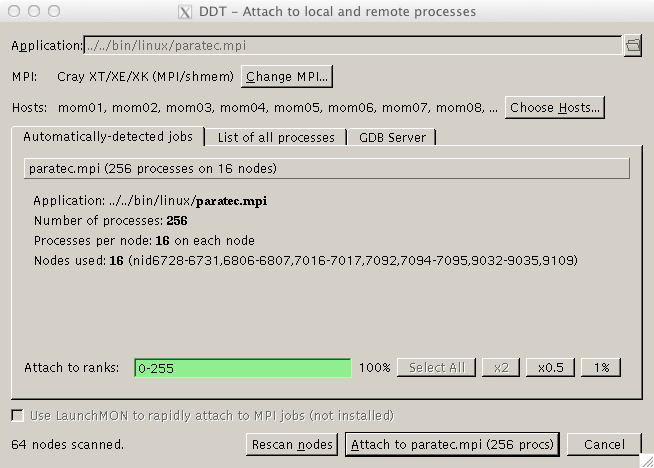
Attach to a running programTo attach to a program that is already running, click on the "ATTACH - Attach to an already running program" button. (With nodes=256 or more, start ddt from the command line with: DDT_NODE_SCAN_TIMEOUT=90 ddt ) DDT will scan each of the 64 mom nodes and locate all of the active jobs that you own, which will appear in the "Automatically-detected jobs" tab. Select the desired job, and click on the "Attach to [job name]" button.
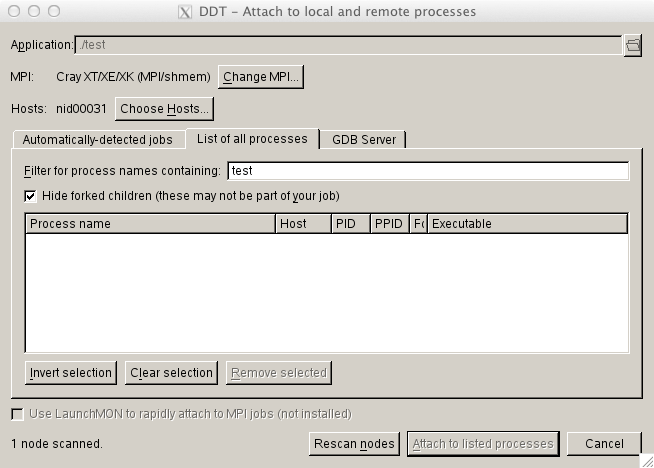
Alternatively, you can attach to a specific process that you own on the "List of all processes" tab.
If you are unable to attach to running jobs or processes (e.g., if they aren't listed), clear out all previously saved Forge settings by removing the ~/.allinea directory, quit Forge and reload it, and then try attaching again.
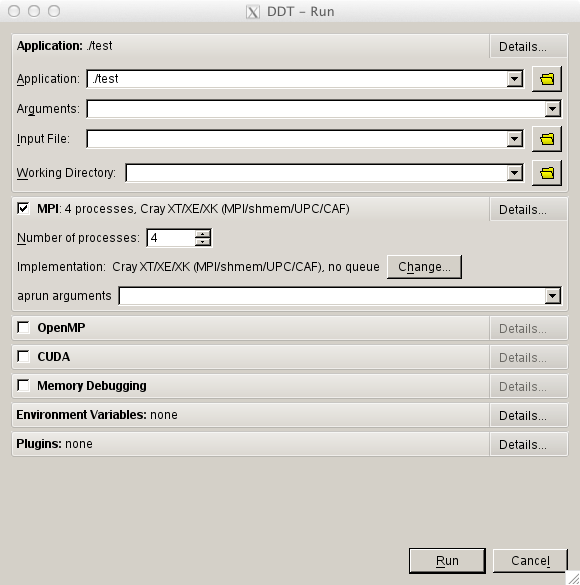
Start a debug session from inside an interactive jobTo start DDT from an interactive job, X11 forwarding must be enabled (-X flag): > qsub -I -X Once the job has started load the ddt module and start DDT with -noqueue flag: > module load ddt-memdebug > forge -noqueue Click on Run and Debug a Program . A new window with expandable tabs will appear. Tabs Application, MPI, OpenMP, CUDA and Memory Debugging are the same as described above.
Click on Run button to start a debug session. |
Skip to Content


Blue Waters User Portal
Sign In


Blue Waters is supported by the National Science Foundation (awards OCI-0725070 and ACI-1238993) the State of Illinois, and the National Geospatial-Intelligence Agency.
Contact Blue Waters Team with questions regarding this page.
Copyright 2024 Board of Trustees of the University of Illinois. All rights reserved. Web privacy notice.