Skip to Content

TAU (Tuning and Analysis Utilities)

TAU is not currently supported on Blue Waters. Please use CrayPAT  for profiling. 

Description

TAU Performance Systems is a portable profiling and tracing toolkit for performance analysis of parallel programs written in Fortran, C, C++, Java, and Python.

TAU (Tuning and Analysis Utilities) is capable of gathering performance information through instrumentation of functions, methods, basic blocks, and statements. TAU's profile visualization tool, paraprof, provides graphical displays of the performance analysis results, to help the user visualize the collected data.

How to use TAU

  1. Load the TAU module.

    module load tau

    or

    module load tau/<specific_version>

    Please note that in a submitted job script, by default the "module" command is not available, so any module command such as "module load tau" will fail. For the module commands to work, one can use one of the following two methods:
    1. Add the following line before executing the module commands. If you use bash, do:

      source /opt/modules/default/init/bash

      If you use csh/tcsh, do:

      source /opt/modules/default/init/csh

      This line is listed in the example script in the Blue Waters "Getting Started" Guide, and in the comments in the example script in the "Batch Jobs" section of the Blue Waters User Guide.
    2. Alternatively, make the following the first line in your job submission script. If you use bash, use:

      #!/bin/bash -l

      If you use csh/tcsh, use:

      #!/usr/bin/tcsh -l

      The "-l" option makes the shell for the job as a login shell, so it sources the needed resource files and defines the "module" command.
  2. Use one of the following two methods to profile the application:
    1. Instrument the source code using TAU, then execute the generated executable:
      				aprun -n <num> ./pgm_instrumented_with_TAU
    2. Use "tau_exec" to measure an unmodified executable:
      				aprun -n <num> tau_exec -T mpi ./pgm_without_TAU_instrumentation

      Please note: the tau_exec method requires the measured program to be dynamically linked. Add the "-dynamic" option in LD_FLAGS or CC_FLAGS when building the measured program to create a dynamically linked executable. Otherwise, the default compiler options on Blue Waters will build a statically linked executable. You can run "file <program1>" to check whether program1 is statically or dynamically linked.

  3. Analyze the generated TAU profile or trace files. For profiles, use TAU's "pprof" for a simple text output, or "paraprof" for a GUI interface; for traces, use "jumpshot".

Examples

The instrumentation method:

  1. module load tau
  2. Edit the application's Makefile to instrument with TAU. The following example used the MPI-PDT TAU make file in PrgEnv-gnu. You can also use other TAU make files.
    		TAU_MAKEFILE=/sw/xe/tau/2.25.1/cle5.2_gnu4.8.2/craycnl/lib/Makefile.tau-gnu-mpi-pdt
    CC=tau_cc.sh
  3. make
  4. aprun -n <num> ./pgm_instrumented_with_TAU

The "tau_exec" method:

  1. module load tau
  2. aprun -n <num> tau_exec -T mpi ./pgm_without_TAU_instrumentation

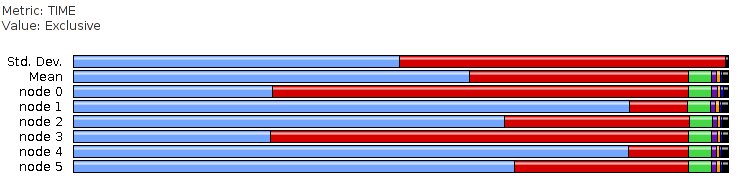
For both methods, to view the profile results, either run TAU's "pprof" in the directory containing the profile.* files to see a text-format output, or pack, transfer to a local machine, unpack, and use TAU's "paraprof" (a Java program) to visualize:

paraprof --pack results.ppk

scp to a local machine. On the local machine,

paraprof --dump results.ppk
paraprof

Two sample ParaProf screen snapshots are below. Profiling results on all MPI ranks:

TAU profiling results on all nodes

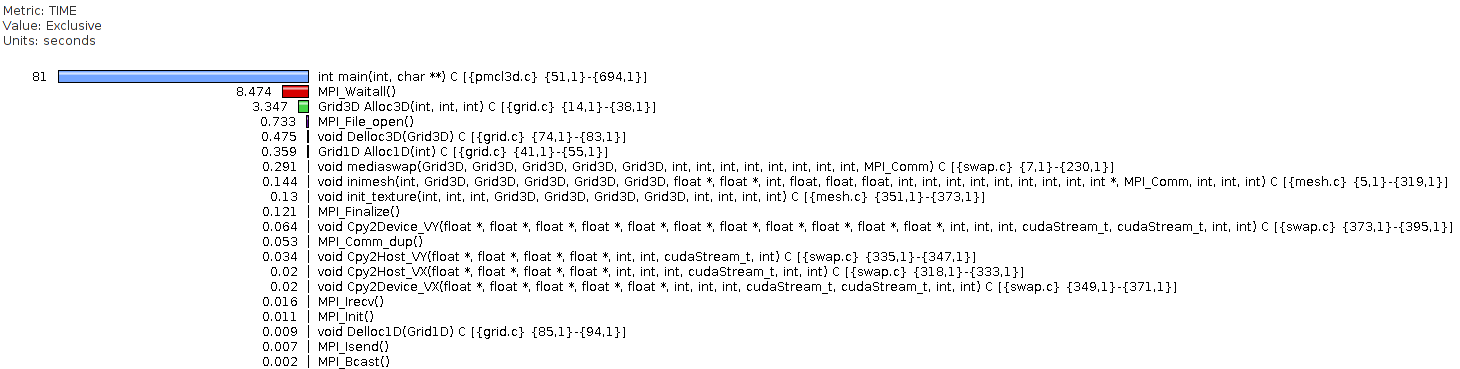
Profiling results of MPI rank 1:

TAU profiling result of node 1

Additional Information / References

  • For More Information.

    General usage information can be found at TAU's documentation web page, at: http://www.cs.uoregon.edu/research/tau/docs.php.

  • Visualization with TAU.

    For visualizing profile or trace files TAU generated on a remote machine, one can install TAU on a local Unix/Linux machine (a simple, default TAU installation is good enough), then transfter the files from the remote machine, then run "paraprof" or "jumpshot" from the local machine. This way the GUI will be much more responsive.

    While transferring the files, one can pack the files with the "--pack" option to paraprof before moving them.

  • GPU profiling.

    For GPU support on the XK nodes, there are two methods: using TAU or using NVIDIA's native tools (command line profiler and nvvp). In both cases, it is suggested to use the option when using nvcc to compile: --compiler-options '-finstrument-functions', so functions in the "*.cu" file are also profiled.

    • Using TAU.

      One can use tau_exec with an uninstrumented executable to profile, using the tau/2.25.1 module. An example job submission script for PrgEnv-intel follows.

      				#!/bin/bash -l
      #PBS...
      module swap PrgEnv-cray PrgEnv-intel
      module load tau/2.25.1
      source ...
      
      aprun -n 2 tau_exec -T mpi,cupti -cupti \
          -XrunTAU-cupti-intel-mpi-pdt ./simpleMPI
      This will profile the functions in the application, the MPI calls and the CUDA calls together in the profile.*.*.* files. Replace "intel" in the above "-XrunTAU" part with "gnu" or "cray" for PrgEnv-gnu and Prg-cray, respectively, or "-XrunTAU-cupti-mpi-pdt-pgi" for PrgEnv-pgi.


    • Using NVIDIA's native tools.

      To profile CUDA kernels, our experience showed that NVIDIA's nvprof did not work, but one can use NVIDIA's command line profiler, which is enabled with the setting of the environment variable COMPUTE_PROFILE. Then one can use NVIDIA's "nvvp" to visualize it. For reference please see: https://bluewaters.ncsa.illinois.edu/openacc-and-cuda-profiling.

      When using the command line profiler with "nvvp", an example configuration file, named "nvidia.cfg" is:

      				profilelogformat CSV
      streamid
      gpustarttimestamp
      gpuendtimestamp
      An example script, named "example.sh", is:
      				#!/bin/bash -login
      module load cudatoolkit
      THIS_NODE=`hostname`
      export COMPUTE_PROFILE=1
      export COMPUTE_PROFILE_LOG=$THIS_NODE.log
      export COMPUTE_PROFILE_CSV=1
      export COMPUTE_PROFILE_CONFIG=nvidia.cfg
      ./executable
      Then one can run
      				aprun -n 2 ./example.sh
      This will generate *.log files, which can be examined/visualized using nvvp.

Acknowledgement

Thanks a lot

  • to Dr. Nuno Cardoso at NCSA for providing the nvprof info above and suggesting adding it here,
  • to Dr. Gengbin Zheng and Dr. Bill Gropp at NCSA for providing the info regarding making the "module" commands available in a job submission script and suggesting adding it here,
  • to PhD candidate Ms. Revathi Jambunathan for providing the "nvvp" instructions, including the example configuration file and example shell script above!