CPMAT (Cray CrayPat/Perftools)The Cray Performance Measurement and Analysis Tools (CPMAT), is the primary performance analysis toolset for Cray systems. The tool provides a productive environment that assists the user with application performance analysis and optimization. The toolset consists of components that prepare a program for performance analysis experiments, capture performance data during program execution, process and analyze the data, and present performance results to the user in both a text report and through an interactive graphical user interface. Cray provides a simple method to get started with profiling your application via the perftools-lite module. The steps for using it are:
CrayPat is the data capture tool, which is used to prepare user programs for performance analysis experiments, to specify the kind of data to be captured during program execution, and to prepare the captured data for text reports or for use with other programs. The user can optionally control the behavior of the instrumented program during execution through a set of runtime environment variables that affect what and how the performance data is collected. Examples of this include the enabling of predefined hardware counter groups that track chosen sets of hardware events, the ability to choose the mechanism to use to sample the application, and the ability to modify the number of data files that are written in parallel by the processes. By default, a runtime summarization of the data is provided, which involves aggregation of the data. Follow the steps below :
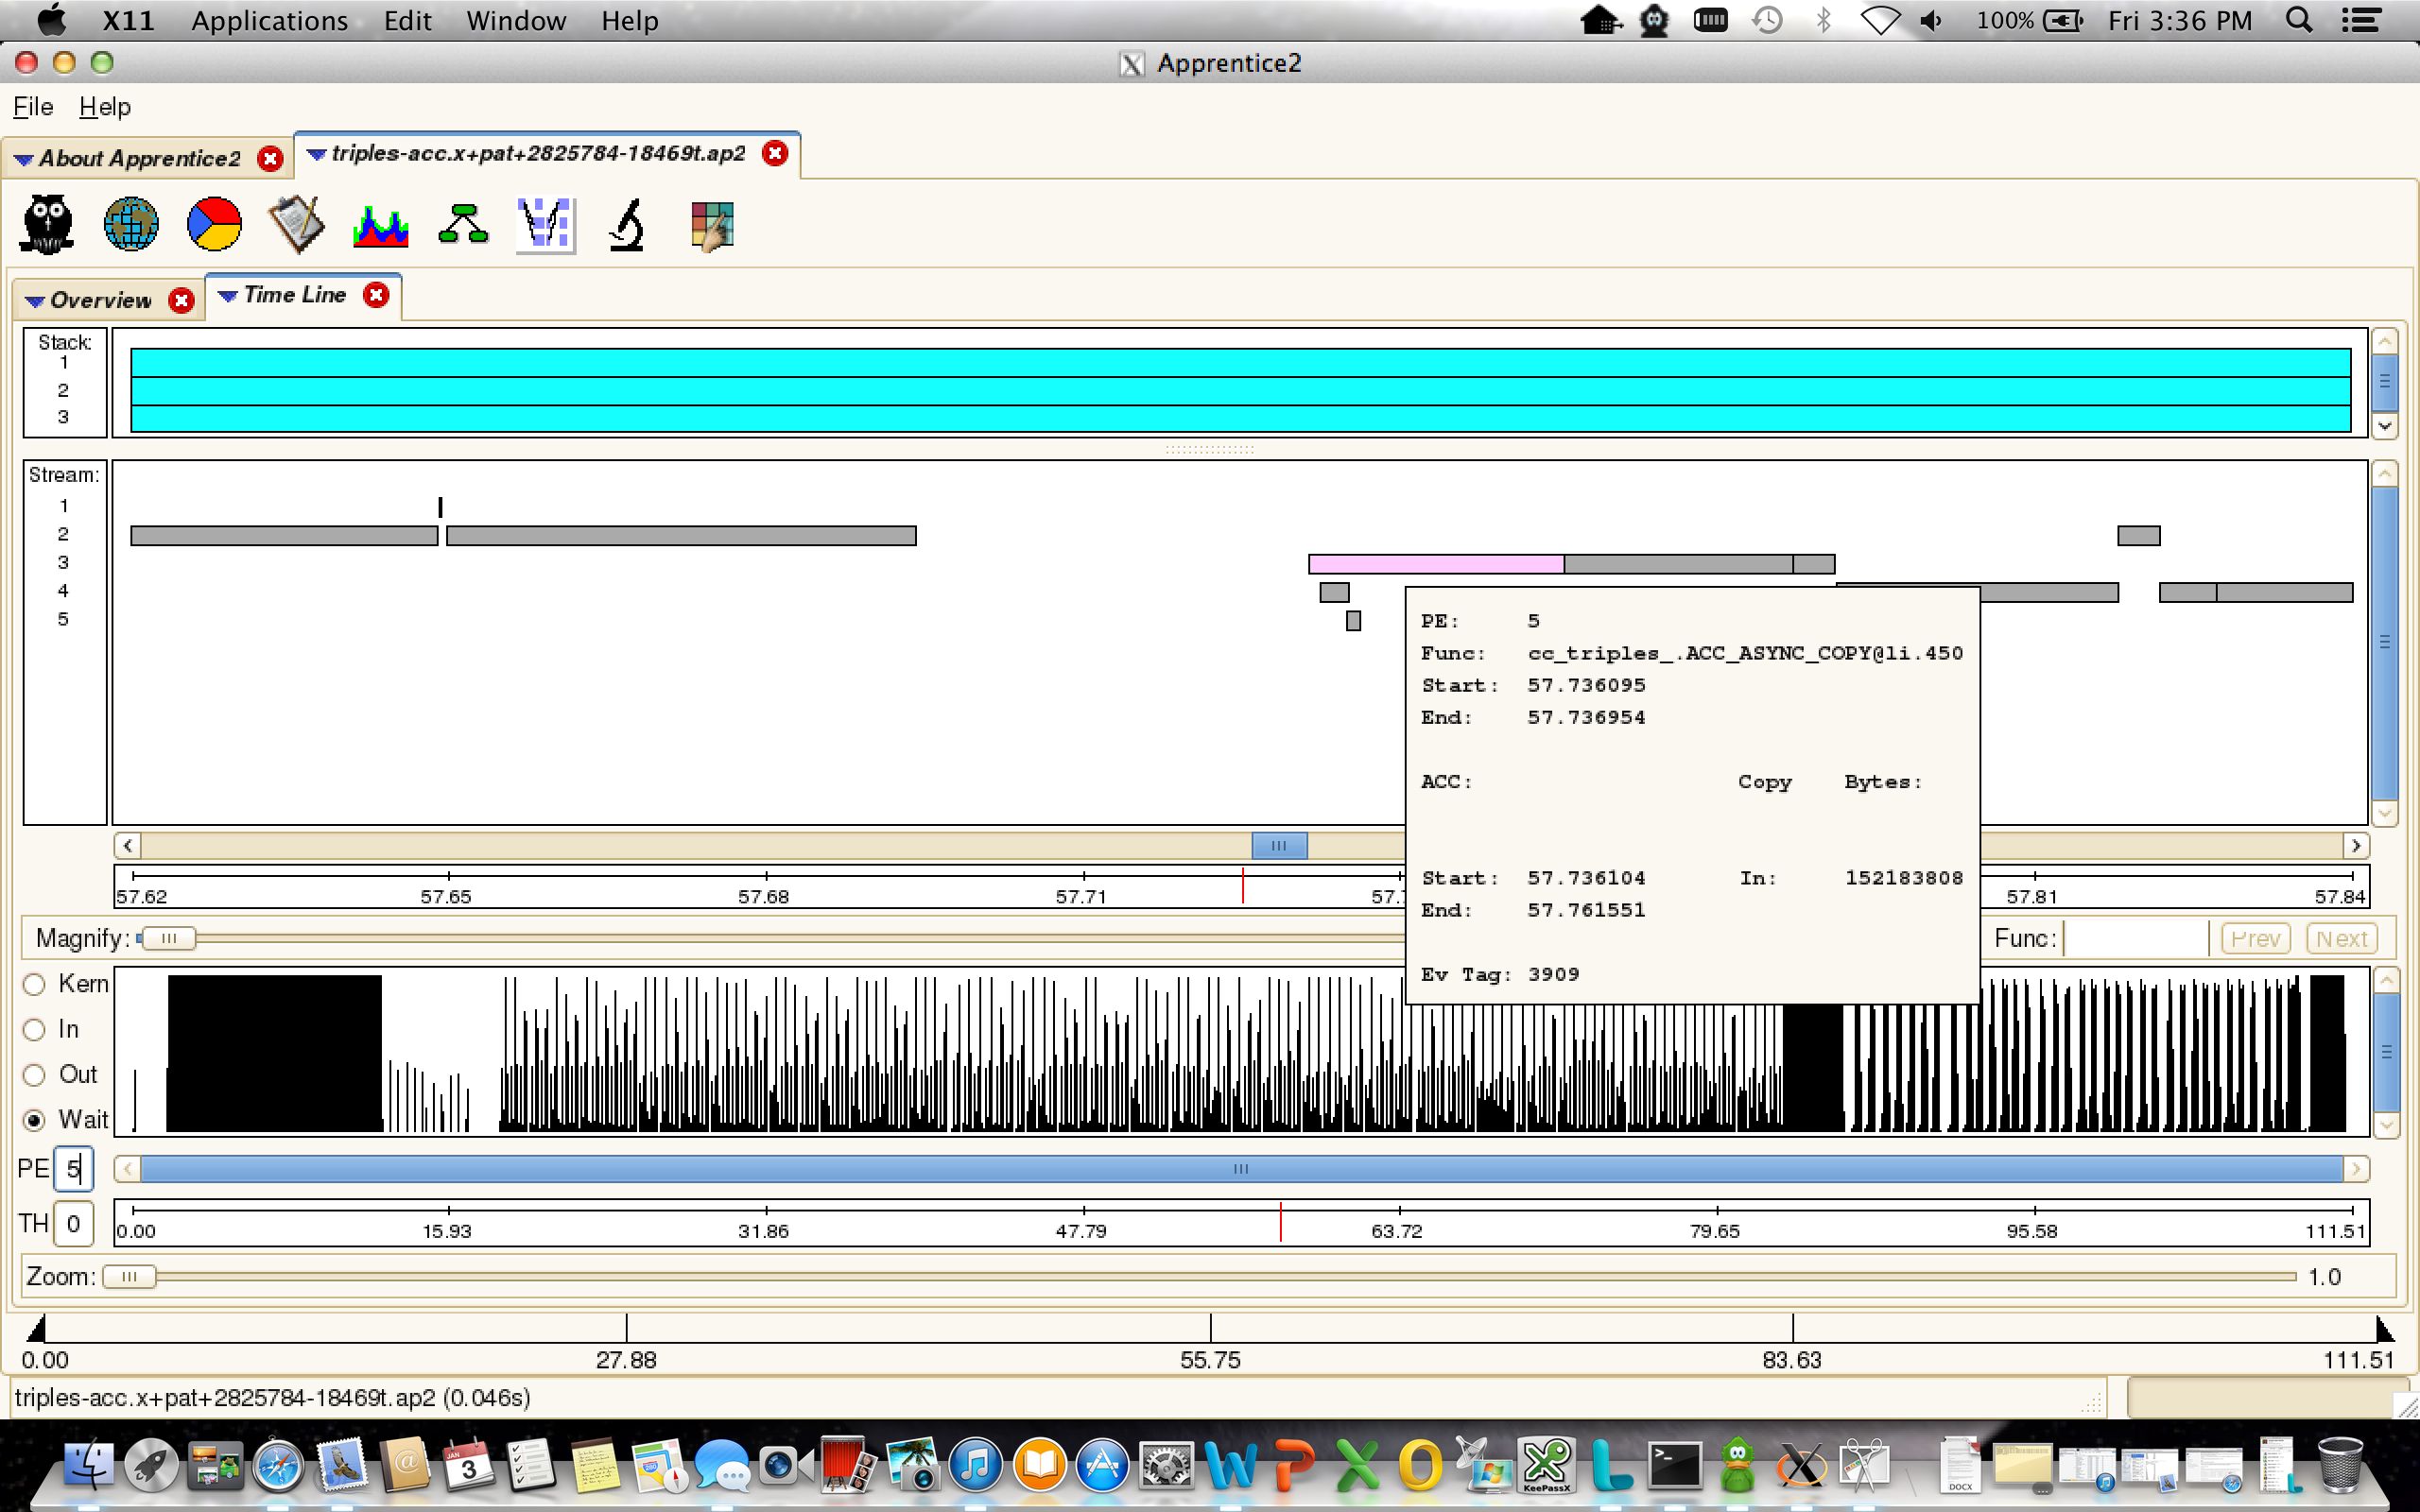
As an example, to build an excutable, the command sequence can be: % module unload darshan; module load perftools-base perftools % ftn -c mytest.f90 % ftn -o mytest mytest.o % pat_build -S mytest To view the CrayPat result after step 4, do: % pat_report mytest+pat+123-456s.xf This will generate the mytest+pat+123-456s.ap2. The information in the .xf file (or directory) is dependent on the exact executable that was run to generate it. You should run pat_report soon after you get your results and before you build your next version of the executable. If you over-write the executable before running pat_report, data in the .xf file becomes useless. pat_report generates a .ap2 file, which contains the same information as the .xf file but with all the meta-information from the executable. The user can use pat_report to extract useful information from the .ap2 file at a later time, without the original executable, on another machine, etc. CrayPat can be used to sample counters at the entrance and exit to certain functions. This is a good way to measure the call frequency of those functions and measure their intensity of certain operations (floating point instructions, for instance). The "-T" option tells CrayPat to instrument the calls (both entrance and exit) of the function name (or names) listed after that option. For instance, "pat_build -T my_main_function -w my_program" will create an instrumented executable version of my_program where the entrance and exit of the function my_main_function are instrumented for counter recording. Instrumenting one main function (which is likely called once and exits once) is useful, for, say, measuring the floating-point instruction density of the entire program. F90 and C++ users would need to use the mangled form of the function name from the linking stage with the -T option. To look up the mangled name for a function "myabcroutine", use: nm a.out | grep myabcroutine. The counters that are sampled by a CrayPat executable are controlled by environment variables at *run time* when the instrumented +pat executable is run. You will need to put those definitions in the run script of the job so that the run script environment will pass the variables on, and they will be visible to the running program. The environment variable PAT_RT_PERFCTR (which used to be PAT_RT_HWPC in older versions of CrayPat) selects the counters that are recorded. You can record up to two program counters simultaneously; their names must be separated by commas in the environment variable. To run an instrumented program that measures the number of floating point operations and the number of total instructions executed within the instrumented functions, put this statement in your run script: export PAT_RT_PERFCTR="PAPI_FP_OPS,PAPI_TOT_INS" Typically, if you're running an executable for the first time, or are making modifications, you'll first instrument the application using the pat_build -S option to run a sampling experiment to get a general idea of what functions the code spends the most time executing. The next step might be to then specifically instrument the several functions that the code spends the most time on and instrument them separately using the -T option. Cray Apprentice displays data that was captured by CrayPat. This visualization tool displays a variety of different data panels, depending on the type of performance experiment that was conducted. Its target is to help identify conditions including load imbalance, excessive serialization, excessive communication and network contention. Cray Apprentice provides call-graph-based profile information with source code mapping and timeline-based trace visualization, also with source code mappings. It is capable of running either on the Cray system service nodes, or on a remote Linux server or workstation. Examples of Cray Apprentice displays are depicted below. Automatic Profiling Analysis, or APA, is a feature of the Cray Performance Tools designed to simplify the process of program instrumentation and data collection for purposes of performance analysis. APA works by first profiling the application for time usage. It uses the profile information gathered to determine an appropriate data collection strategy specifically for that application. APA specifies the strategy in the form of a template file that can be used as input into subsequent performance analysis runs. The steps for using this feature are similar to the five steps discussed for the use of CrayPat. The difference is the ``-O apa'' option for pat_build. Therefore, the above example becomes: % module unload darshan; module load perftools-base perftools % ftn -c mytest.f90 % ftn -o mytest mytest.o % pat_build -O apa mytest This will produce the excutable mytest+pat. After running mytest+pat, do: % pat_report mytest+pat+123-456s.xf This will generate the mytest+pat+123-456s.ap2 and mytest+pat+123-456s.apa files, with the ".apa" file contains suggested pat_build options for building an executable for tracing experiments. One can edit this file, if desired, and use it to re-instrument the program for future tracing. To further improve tool response time, a new distributed Cray Apprentice2 client for Linux has been introduced so that the graphical presentation is handled locally and not passed through the ssh connection between the user's laptop and the Cray service node. Prior to a client/server model, all of the performance data collected from an experiment needed to be loaded into memory before any results were displayed. This created size limitations as well as long load times. The combination of a new scalable data format and this new client/server model minimizes the amount of data loaded into memory at any given time and thus creates a smaller footprint on the Cray service node. A client version for Linux is currently available This is example output from a pat_report:
================  Observations and suggestions  ========================

MPI Grid Detection:

    There appears to be point-to-point MPI communication in a 96 X 8
    grid pattern. The 51.4% of the total execution time spent in MPI
    functions might be reduced with a rank order that maximizes
    communication between ranks on the same node. The effect of several
    rank orders is estimated below.

    A file named MPICH_RANK_ORDER.Grid was generated along with this
    report and contains usage instructions and the Custom rank order
    from the following table.

         Rank    On-Node     On-Node   MPICH_RANK_REORDER_METHOD
        Order   Bytes/PE   Bytes/PE%
                            of Total
                            Bytes/PE

        Custom  1.851e+12      96.56%  3
           SMP  1.459e+12      76.08%  1
          Fold  1.056e+09       0.06%  2
    RoundRobin  0.000e+00       0.00%  0
Use the microscope icon in app2 to look at the mpi (PE) and thread (TH) timelines.
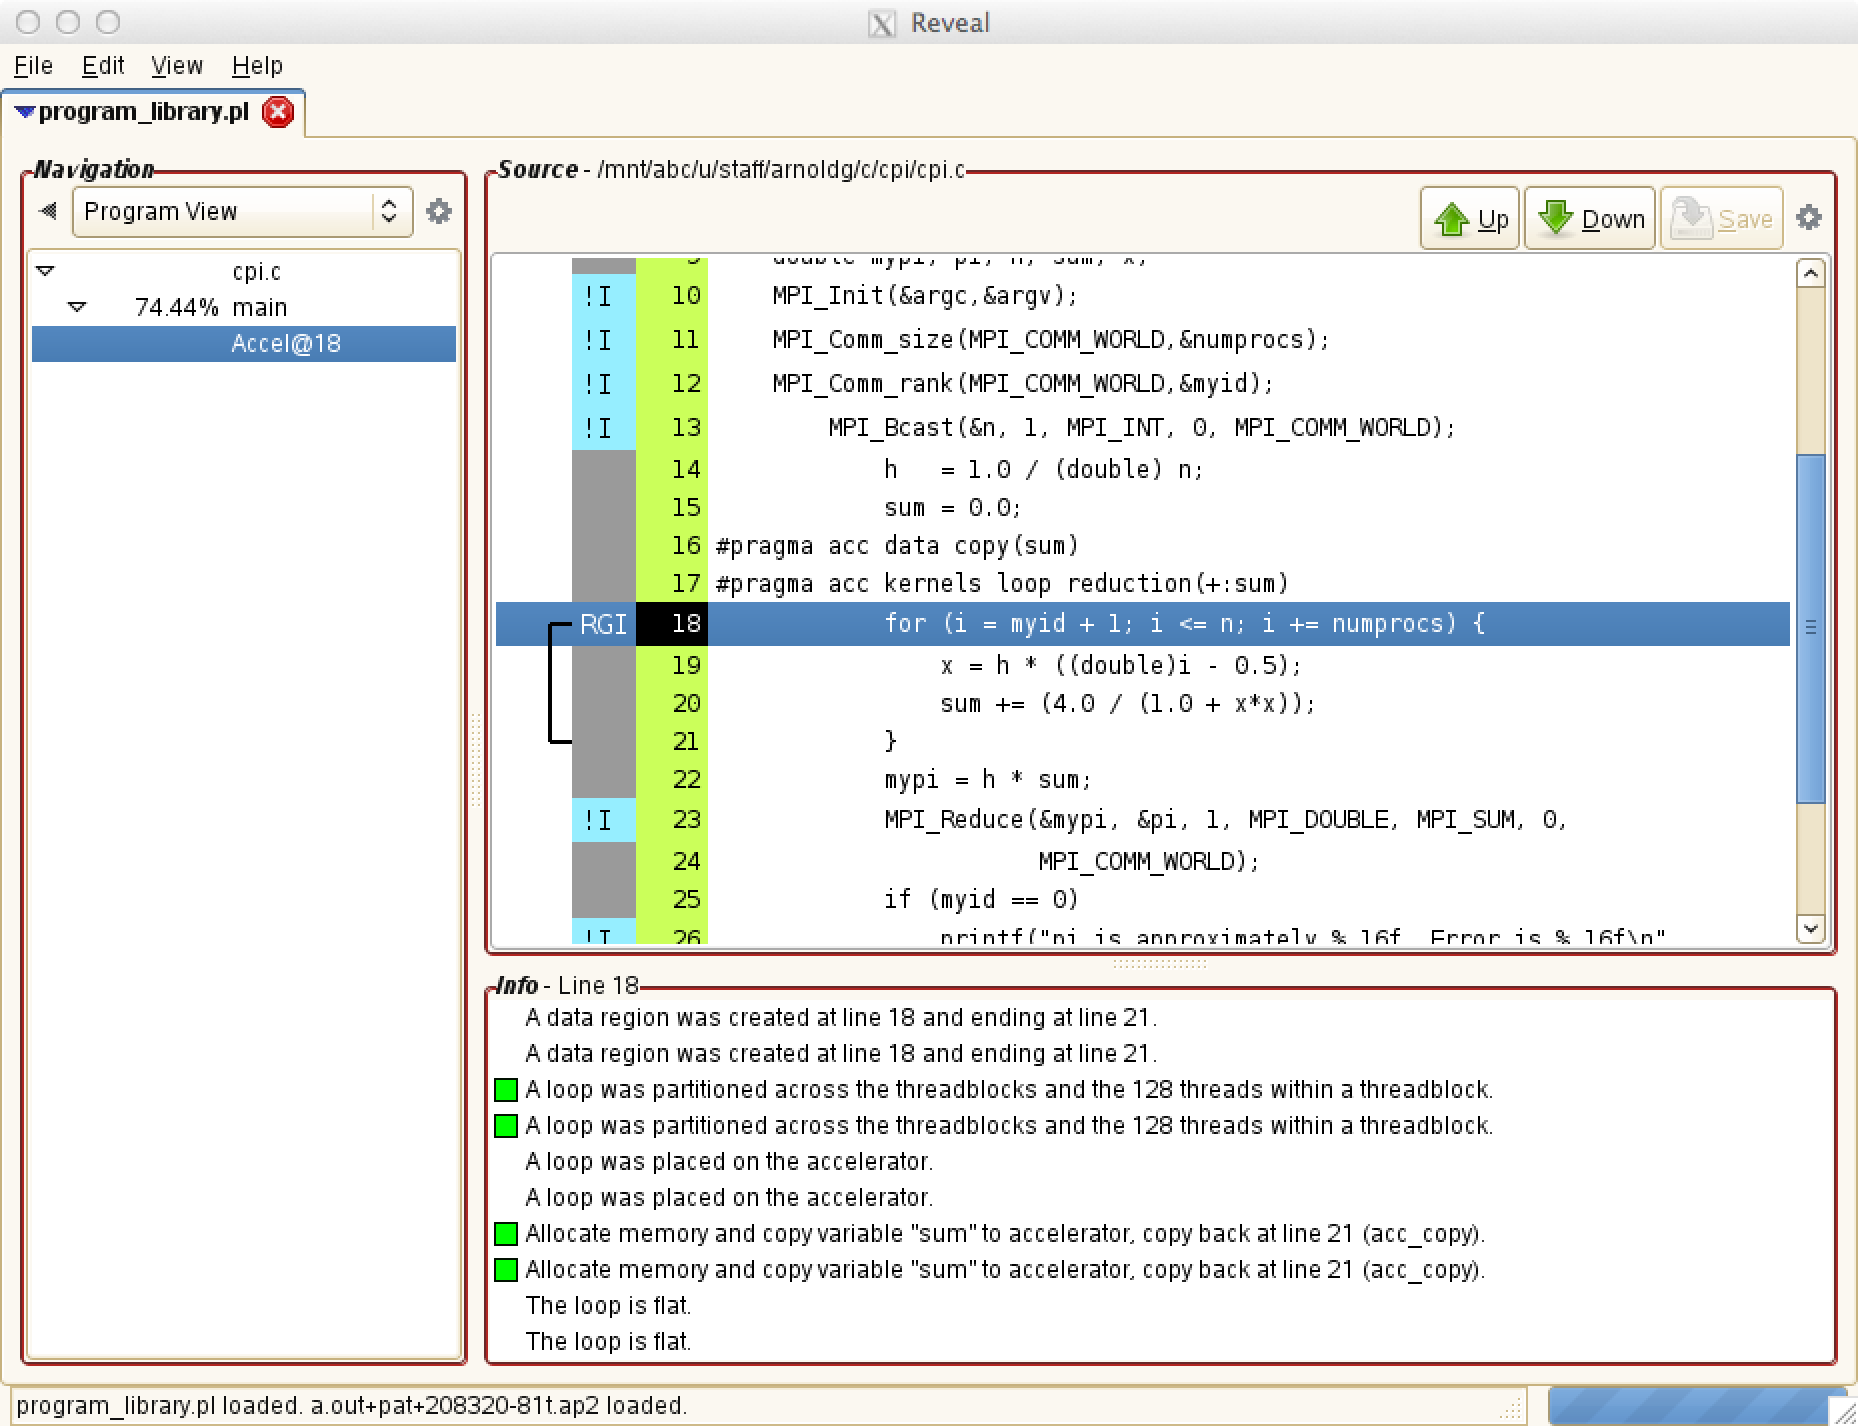
Reveal is Cray's next-generation integrated performance analysis and code optimization tool. Reveal extends Cray's existing performance measurement, analysis, and visualization technology by combining run-time performance statistics and program source code visualization with Cray Compiling Environment (CCE) compile-time optimization feedback. See the man page "man reveal" with perftools loaded for more information.
|
Skip to Content


Blue Waters User Portal
Sign In

Blue Waters is supported by the National Science Foundation (awards OCI-0725070 and ACI-1238993) the State of Illinois, and the National Geospatial-Intelligence Agency.
Contact Blue Waters Team with questions regarding this page.
Copyright 2024 Board of Trustees of the University of Illinois. All rights reserved. Web privacy notice.